Density Plot of Recusive calls
plotDensity.RdplotDensity Plots a density plot of the recursive calls
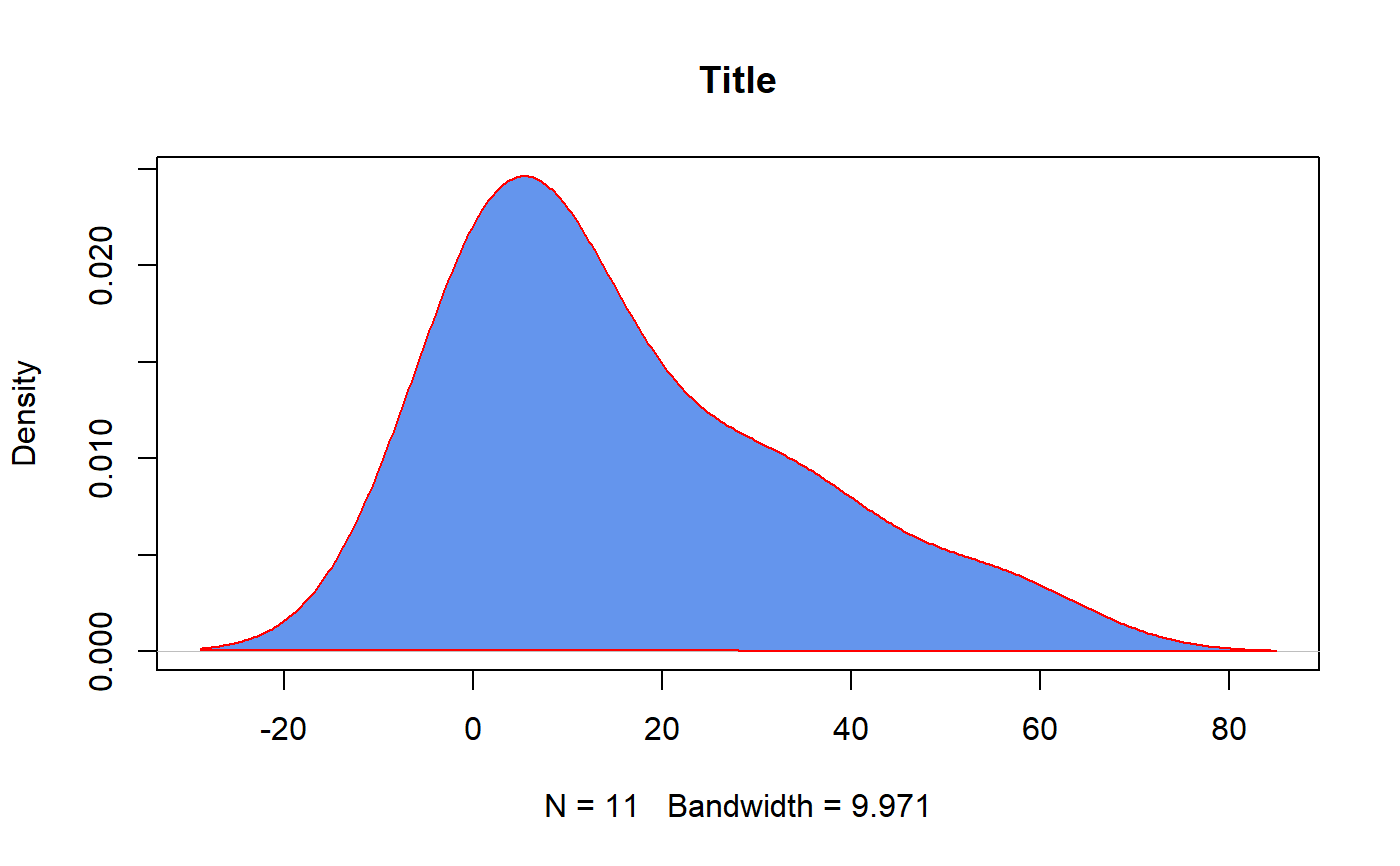
plotDensity(data, title = "Title", color = "cornflowerblue",
  border = "red")
Arguments
| data | output from recDist |
|---|---|
| title | title of graph (defaults to "Title") |
| color | color of area of density plot (defaults to "cornflowerblue") |
| border | color of outline of density plot (defaults to "red") |
Value
density plot of data
Details
This function takes output from recDist and plots a density plot of all recursive calls
Examples
capture.output(recursiveCalls(fib,10), file = "output.txt")
fibResult <- saveCalls("output.txt")
plotDensity(recDist(fibResult))