Distribution Plot
plotDist.RdplotDist Plots a distribution plot of the result of recDist.
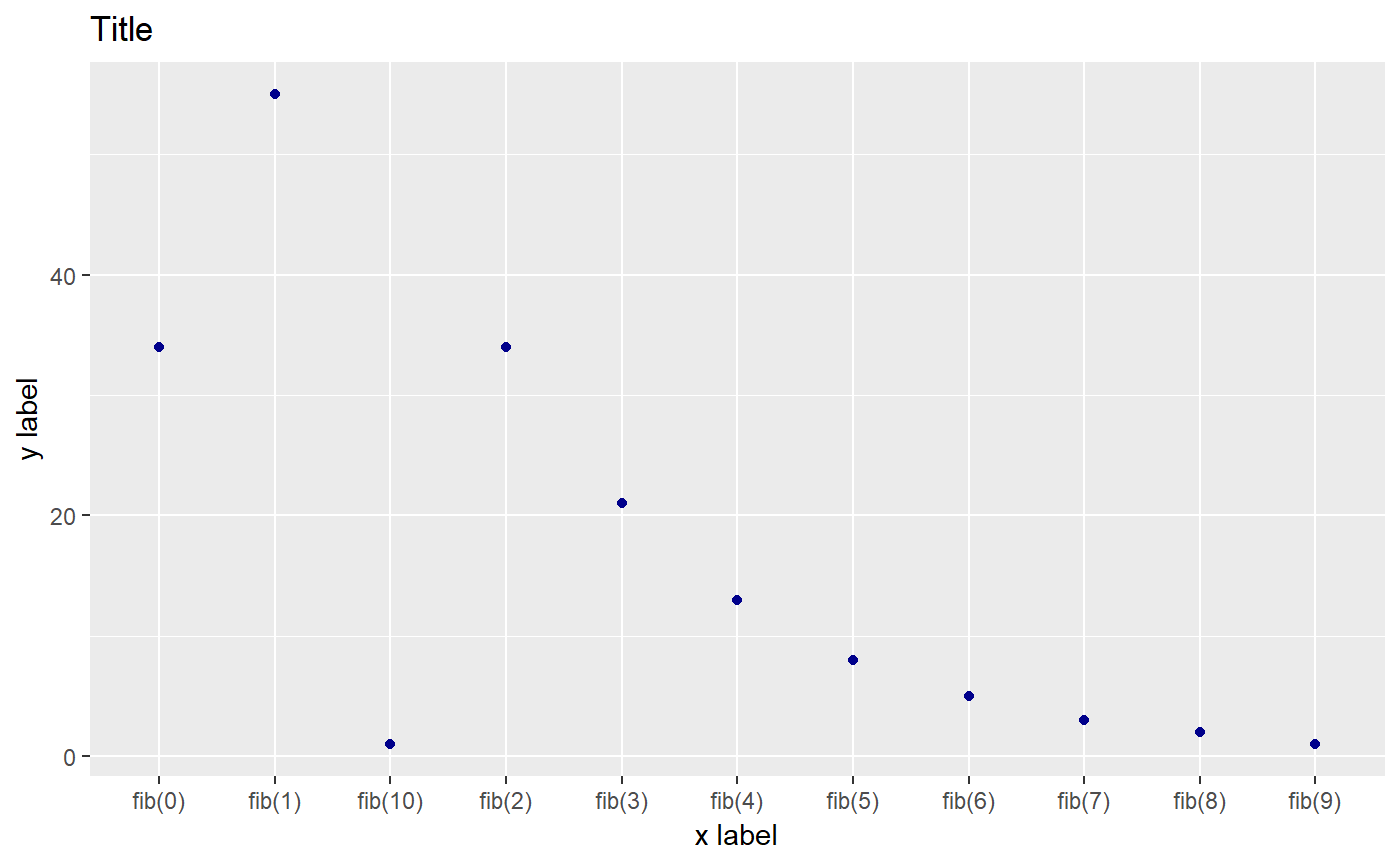
plotDist(data, xlabel = "x label", ylabel = "y label",
  title = "Title", color = "darkblue")
Arguments
| data | result of recDist |
|---|---|
| xlabel | x label title of graph (defaults to "x label") |
| ylabel | y label title of graph (defaults to "y label") |
| title | title of graph (defaults to "Title") |
| color | color of points (defaults to "darkblue") |
Value
the result of x multiplied by y
Details
This function is a visualization tools for the result of recDist. It allows the user to see how often subproblems are called.
Examples
capture.output(recursiveCalls(fib,10), file = "output.txt")
fibResult <- saveCalls("output.txt")
plotDist(recDist(fibResult))